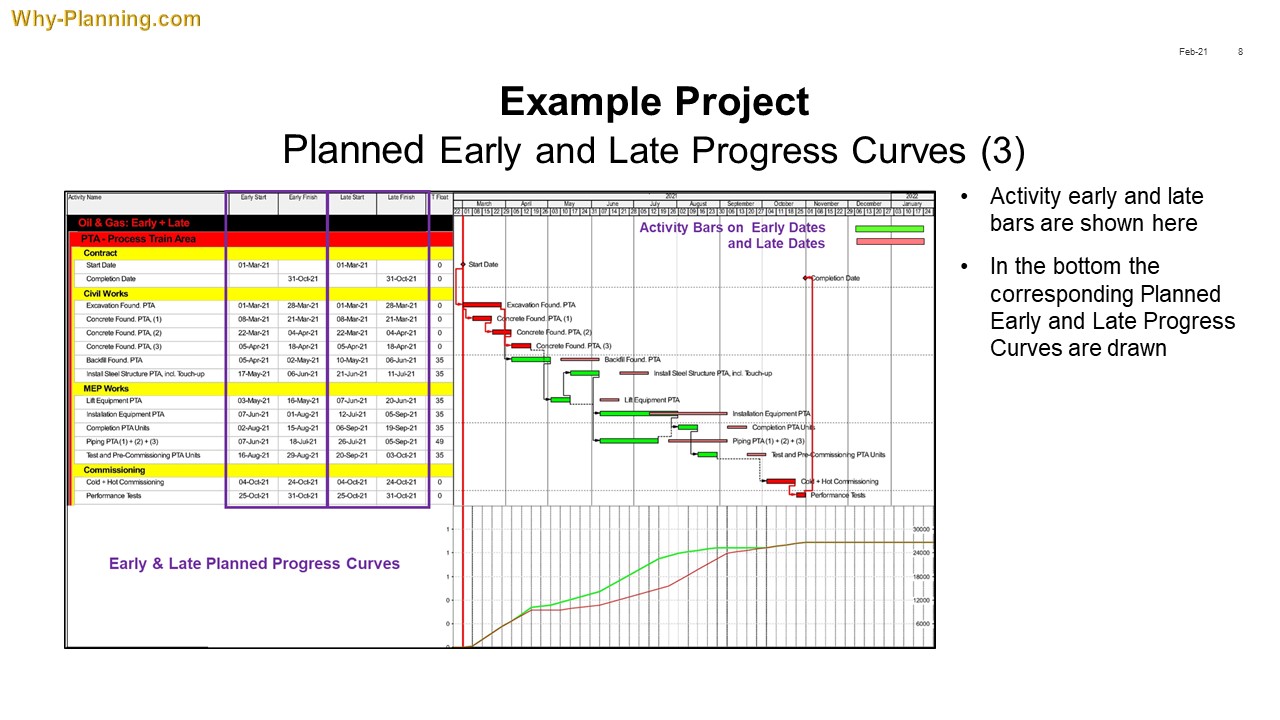
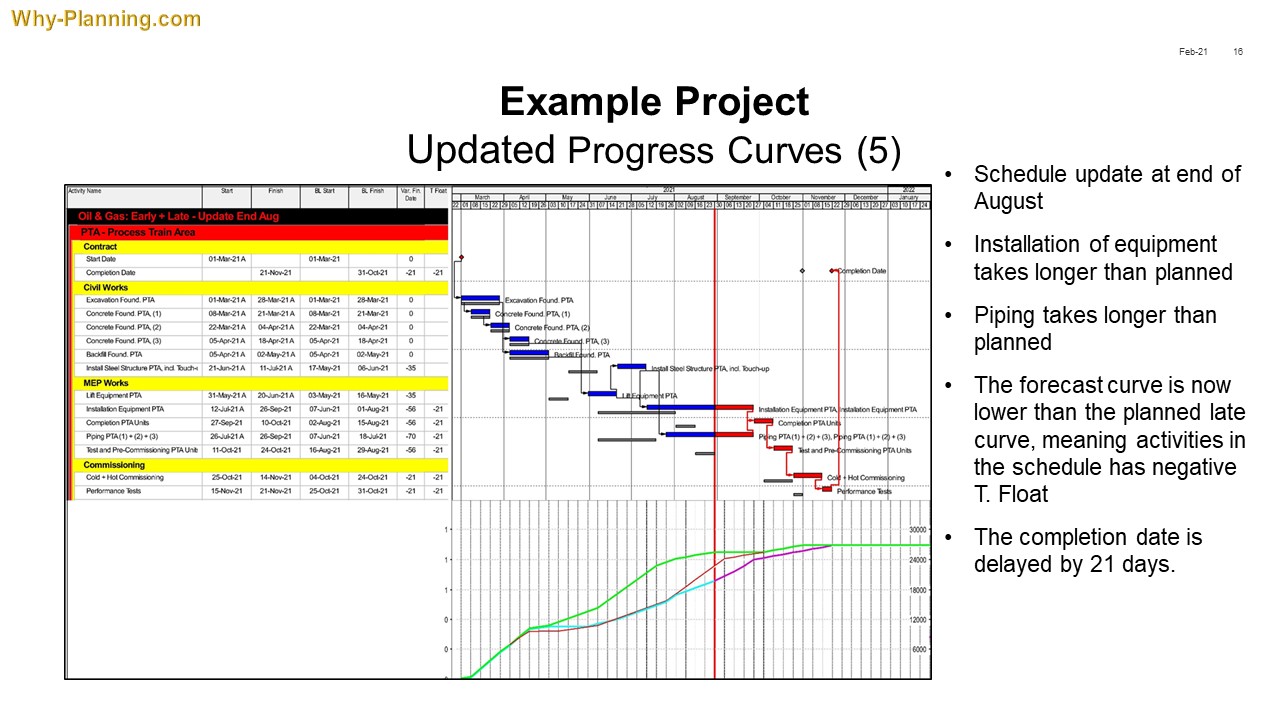
The good practice is that when the Baseline is approved it means that the associated early and late progress curves are approved as well. It is the planner’s task to load the schedule with so called “progress units” and to set in place the earned value method for measuring the progress, e.g. rules of credit, etc.
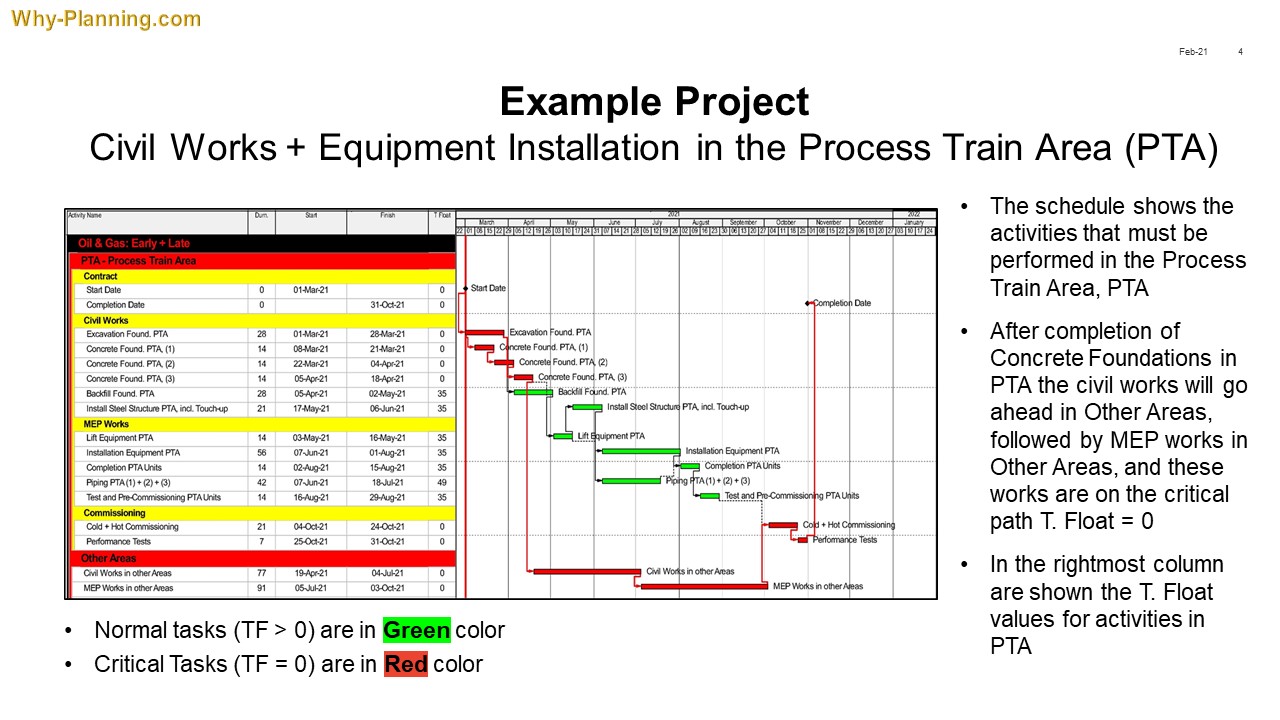
A practical approach would be that, from now on, the project status can be easily evaluated at each schedule update by studying the shape of the planned vs. actual and forecast progress curves. All is described in the presentation below. I choose as an example the civil works and installation of equipment in a process train area, inspired by the Ameriven’s O&G Hamaca Upstream Project in Venezuela.
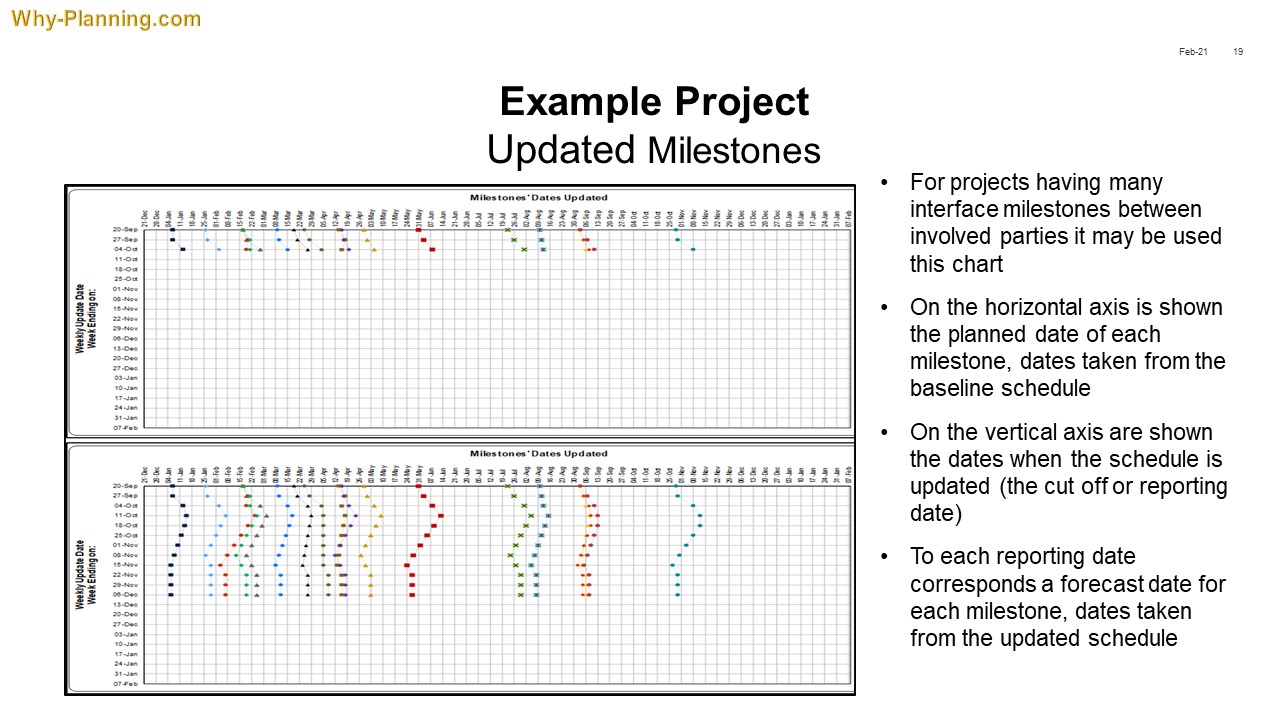
On the last page of this presentation I inserted an “Updated Milestones” chart. I found this form of reporting being extensively used in complex projects with many interface milestones like the O&G or Data Centers projects, etc. It is a practical report to identify tendencies and a great support to decide on implementing corrective actions.
Please be aware of the following:
– The time-schedules used to support my explanation are very schematic; the aim was that the content has not to exceed one page;
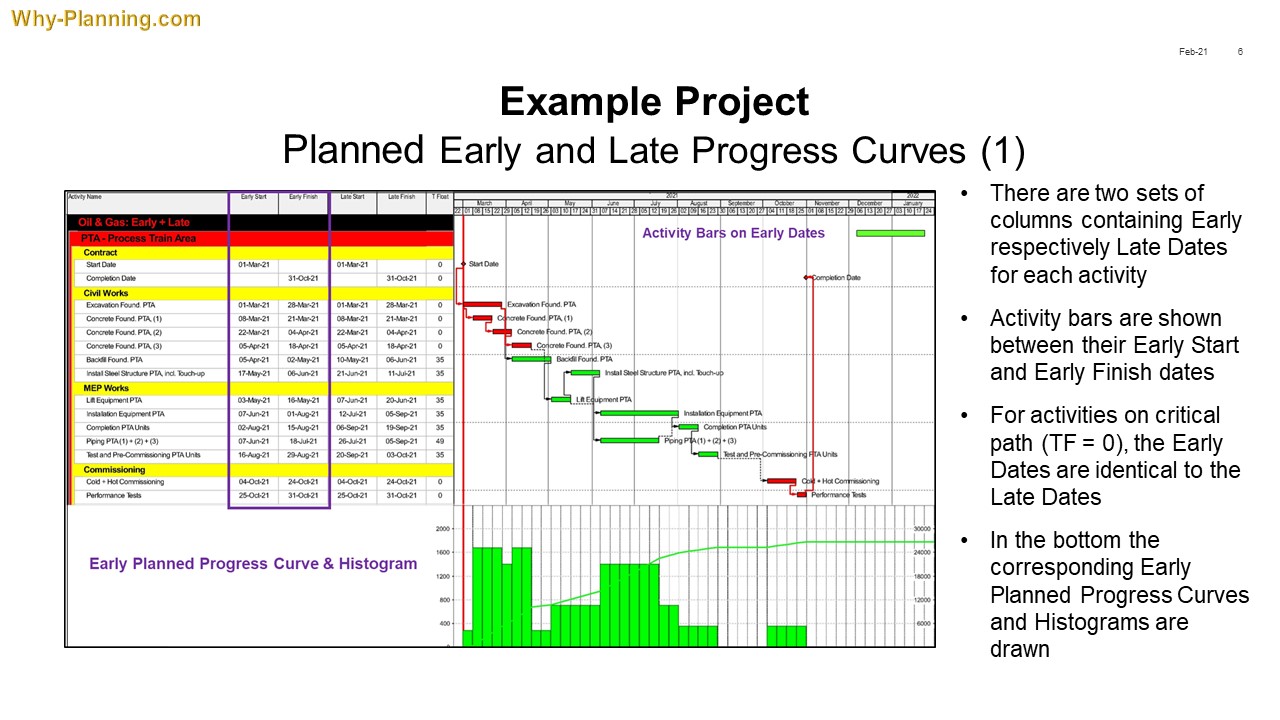
– The content of (almost) each sheet is presented in two areas: (1) pics, bar charts, curves etc. and (2) narrative description. It is advisable that you pay equal attention to both areas as they contain complementary information.
For any inquires, feel free to email me at rt@why-planning.com